AI Shipping Analyst
Unlocking the Data of Billions of Shipments
AI is only as good as the data source.
EasyPost has been the go to multi carrier api since its creation in 2010. Millions of shipment go through its system a month from their customers. It's data resources have unmatched historical context for parcel shipping and trends, but up until recently was unable to fully utilize it.
It had been well documented for years that customers routinely asked for help analyzing their shipment data generated through EasyPosts system. There was also growing pressure from competition in market to empower more advanced order routing "using AI."
The data analytics team had the data, and the customers looked to EasyPost for expertise, but we didn't want to just force AI in because the competition was. Ensuring it would be useful, not a gimmick, and impactful was the perspective we took from the beginning.
Competitive Research
While being a legacy player in the logistics technology space made the source data for the AI tooling extremely useful, it also came with its challenges. A combination of tech debt and limited engineering resources made EasyPost one of the slower AI adopters in the space. While Sales had its complaints on speed, from a research perspective, we were able to learn from the success and failures of the competition.

The Shipping AI Platform for modern supply chains. Shippium's go to market focused 100% on being the modern technology solution and making "logistics simple."
What we learned:
They were in fact better at data visualization, and empowering non technical users to create advanced order routing rules. But routinely failed to onboard their new customers because of lack of integrations and limited depth in functionality. We recorded over 10 instances of a prospective customer returning to us after choosing to go with Shipium.
Key Takeaway:
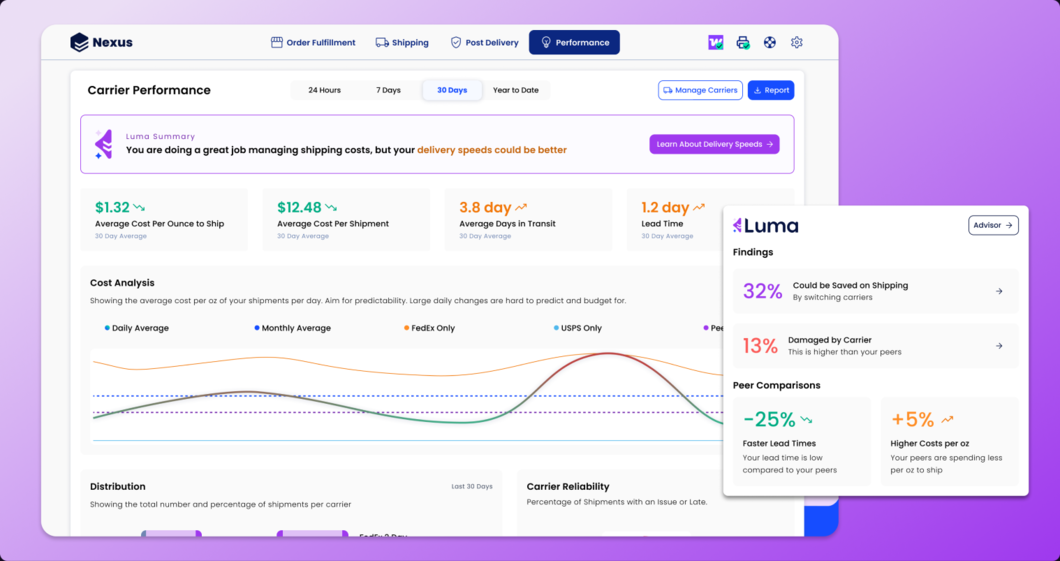
We had the functionality, integrations and partnerships that Shipium missed, but their flashy Data Visualization and analyst was what won the sales deal initially. The data visualization and creating actionable insights for non technical users was our focus.
Research Findings and Prioritization
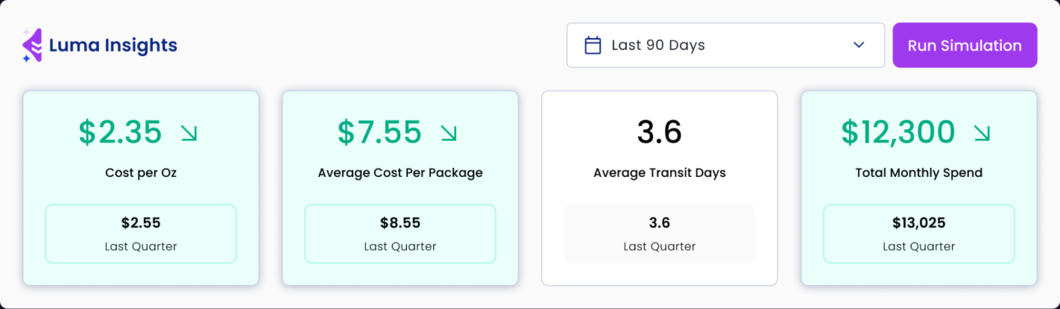
The customers of EasyPost varied widely with many different industries, shipping volumes, and complex business needs. We analyzed down to 3 metrics that covered over 80% of customer needs.
Key Metrics Tracked By Users:
- Average Cost per Shipment Tracking
Delivery Cost change over time is ultimately the tracked data set. It can be difficult to track on its own because as a company grows, it ships more. As it ships more, of course shipping costs go up. It can be hard to properly track if the growing cost is optimized or not. An average cost per Oz shipped is one of the ways this can be tracked, but then that needs to be matrixed against different carrier performance and other factors.
- Delivery Reliability
Predicted Delivery Date VS Actual Date Delivered. Many merchants state 2-3 day shipping on their website. Missed delivery windows hurt their reputation. Lost packages also hurt their bottom line with having to take losses on both the shipping cost and the item itself.
- Carrier Minimums
For the bigger customers, like Sephora, they negotiated direct contracts with carriers. The carriers give them discounted rates, but they are required to ship a minimum amount every month (or quarter). Tracking this and making sure they are meeting those minimums are crucial, but also a trap. They want to know if they could be doing better by going with a different carrier, but they don't know and not empowered to look.
Common Customer Pain Points:
- Picking which Carrier and Service to use
There are thousands of regional carriers alongside UPS, FedEx, DHL, USPS. All of them are constantly changing their rates, fees, services levels and their coverage areas.
- Optimizing the Shipments for cost savings
Surprisingly complex! Many of our larger customers have multiple locations to ship products out alongside orders that could be shipped in one or many boxes. It becomes a complex decision tree of weight x size x carrier x service fees x distance traveled x carrier reliability and more. It may be cheaper to do one heavy box with one carrier, but if split in two shipments it will be cheaper with a different carrier.
Strategizing MVP and Iterative Improvements
EasyPost was in a tough spot. Not only did they need to train an AI, they didn't have a proper data visualization library or a UI for managing shipping logic. Up until this point, advanced EasyPost shipping logic was done through customers taking the time to script or paying consultancies to do it for them.
So we prioritized value over beauty and created a phased approach that split the work into 3 phases.
Key Metrics Tracked By Users:
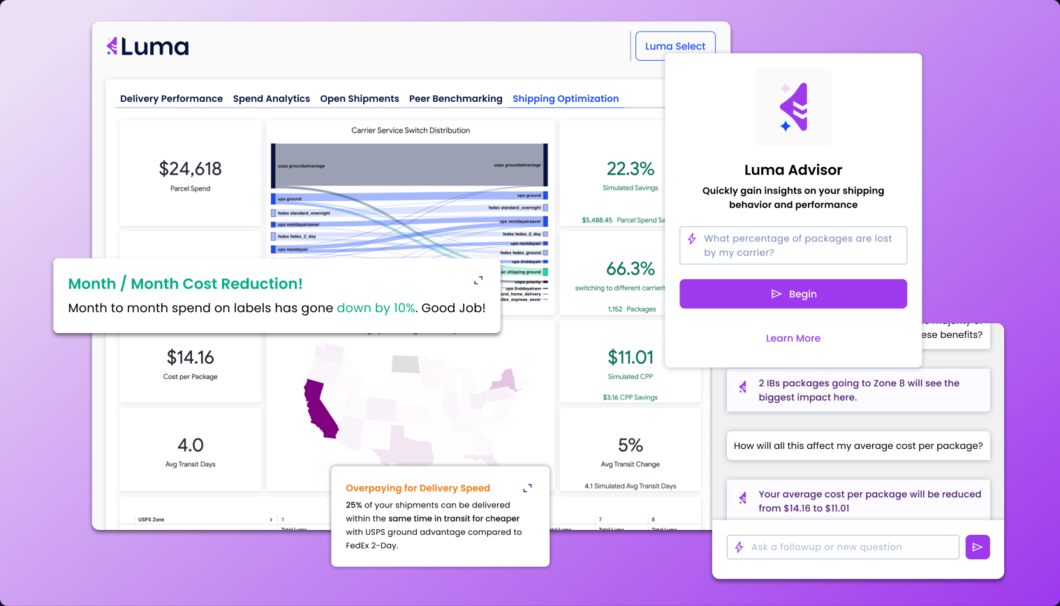
- Create the AI Shipping Analyst
Using looker dashboarding tooling stand up dashboards that reflect the research findings and introduce a light AI chat experience.
Tech spike estimate:
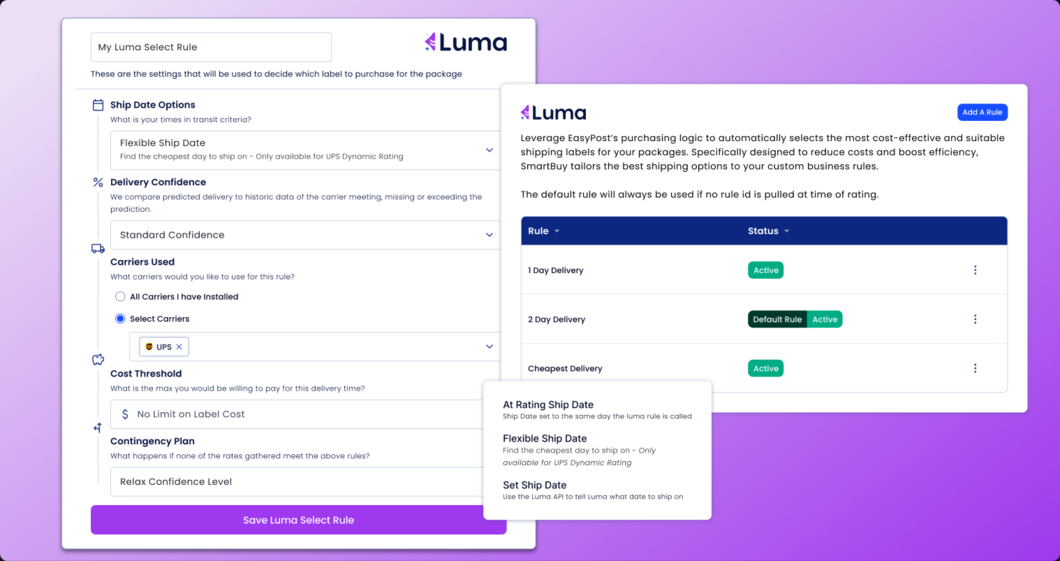
Rolling releases totaling 1 quarter backend | 1 week upfront, small tickets for rolling releases - Stand up built in logic builder
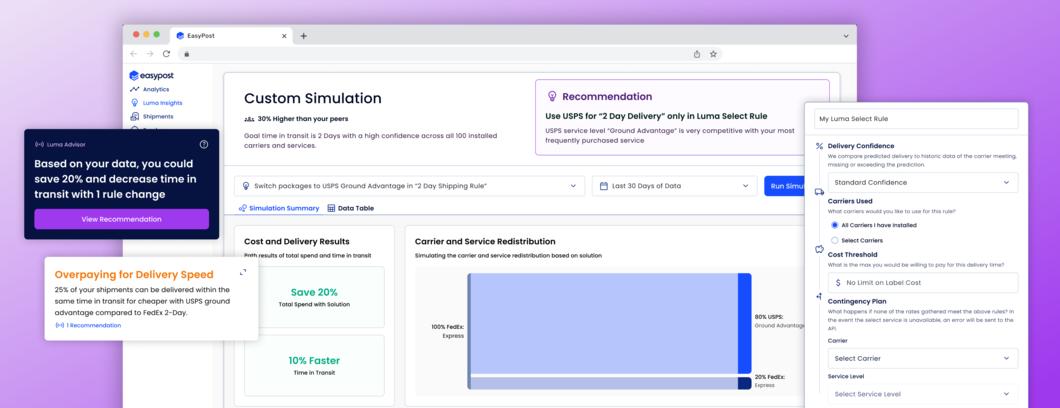
Create a UI based experience that can create carrier routing rules and/or visualize the scripts created outside of the system.
Tech spike estimate:
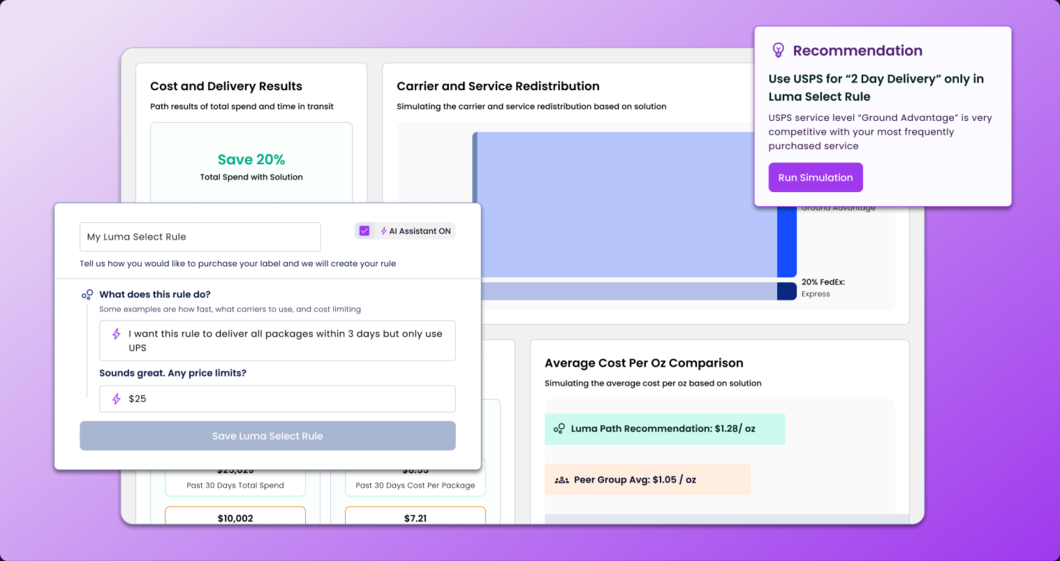
2 weeks backend | 2 weeks frontend - Make steps 1 and 2 talk to each other alongside creation of data viz library
Let the AI shipping analyst suggest rule changes and, when applicable, make those changes for the user.
Tech spike estimate was punted on until step 1 was complete.
The estimate was about 1 quarter for backend | 1 quarter frontend
Step 1 Launch the Shipping AI Analyst
Step 2 Advanced Rule Configuration Simplified
Step 3 Connecting Step 1 + 2 with visual polish
Forward Looking Concepts
Success
This project was a huge win for EasyPost from a variety of angles. Sales had a better sales pitch against Shipium. It is now referenced as the reason a new sales deal was won 30% of the time.
Luma Rules usage. The advanced routing selection tool has had great adoption. Customers pay more per shipment to use these rules and it quickly grew to over 1m monthly shipments using it.
Customers have routinely commented on the functionality being exactly what they need with most dashboards getting quarterly usage from 80% of the customers. The research on what was truely required was successful.
Lessons Learned
This was my first full, from scratch, AI project. There was a lot of learnings about the space and the way users utilize and think about AI assistants. Initial trust is extremely small the first few times a user interacted with the assistant, however if no issues were encountered within the first few sessions, users began to blindly trust the assistant. This drastic switch is fascinating and has informed how I approach new AI projects.