Flow Charts, Canvases, and Tiles Oh My!
The Internet is Eating the World
Building a UI and visual design recommendation for Conductor1's open source connector
Conductor1 is the best identity management platform for monitoring account permissions of humans and AI agents. Back when they were first launching the company in 2022, I was hired to recommend a visual design and design base UI components for their open source offering: Baton.
Monitoring permissions for all the SaaS offerings a company is using is a game of whack-a-mole for Conductor1. Building integrations for everything was never going to be sustainable, so they created Baton so their customers could build their own integrations as needed. This was important to get right the first time because it was setting their first UI impression in market.
UI Formatting and Components
Overall Structure: Canvas and Dependency Charting
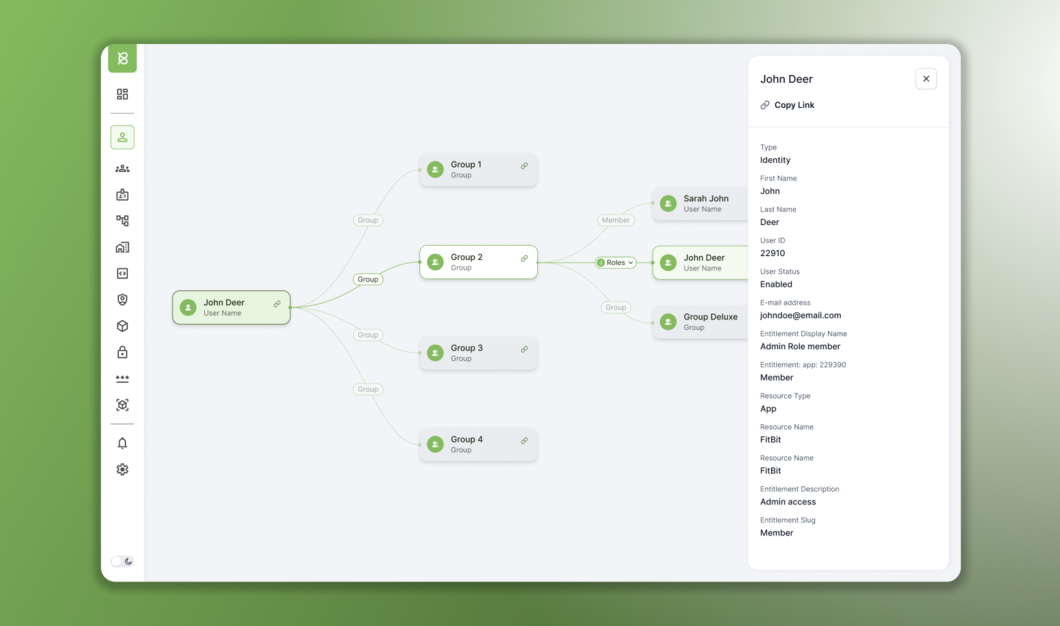
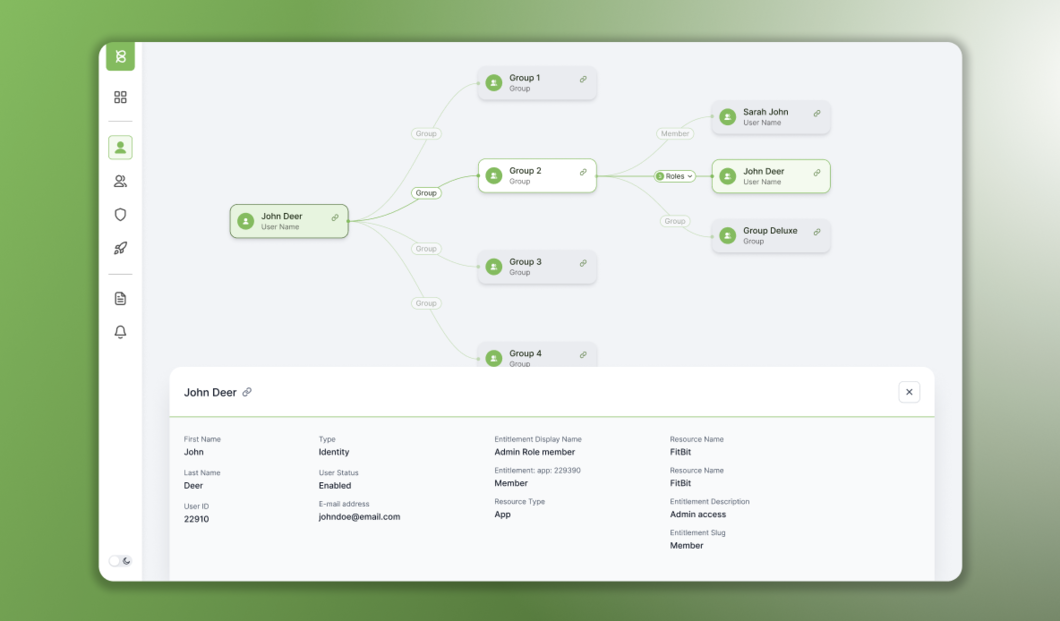
One of the most important parts of the Conductor1 product experience is visualizing the permissions dependency map. Showing who has what permissions across various apps and how those permissions affect various product usage.
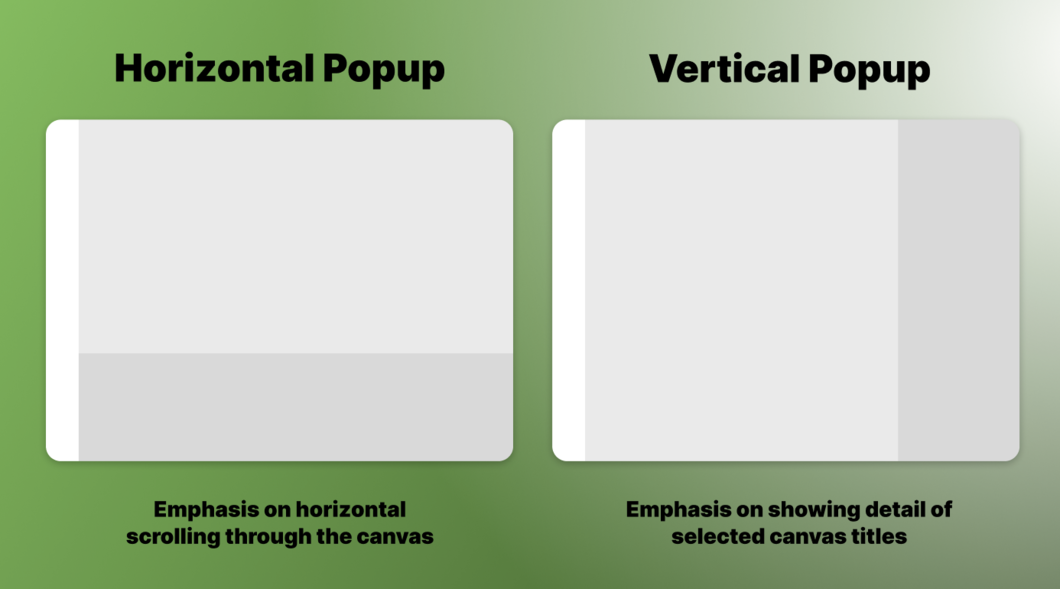
The UI had a choice, focus on the horizontal scrolling through the dependency chart, or focus on the vertical reading of additional details when selecting a piece of the map.
After discussion with the team about the most common use cases, we landed on a vertical pop up for more details. The previous solution of seeing both the map and those details at the same time was not a common need by most users.
Card Components and Visualizing Data
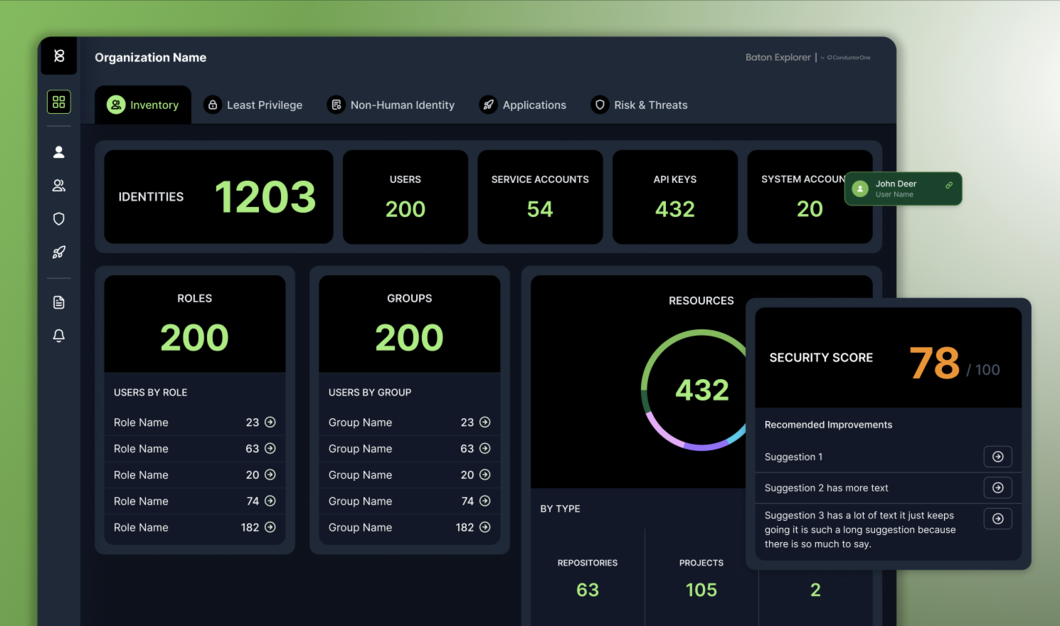
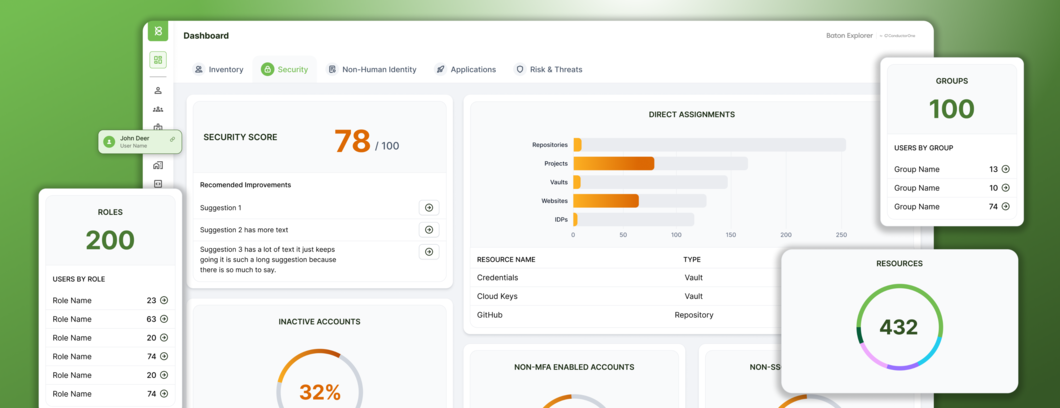
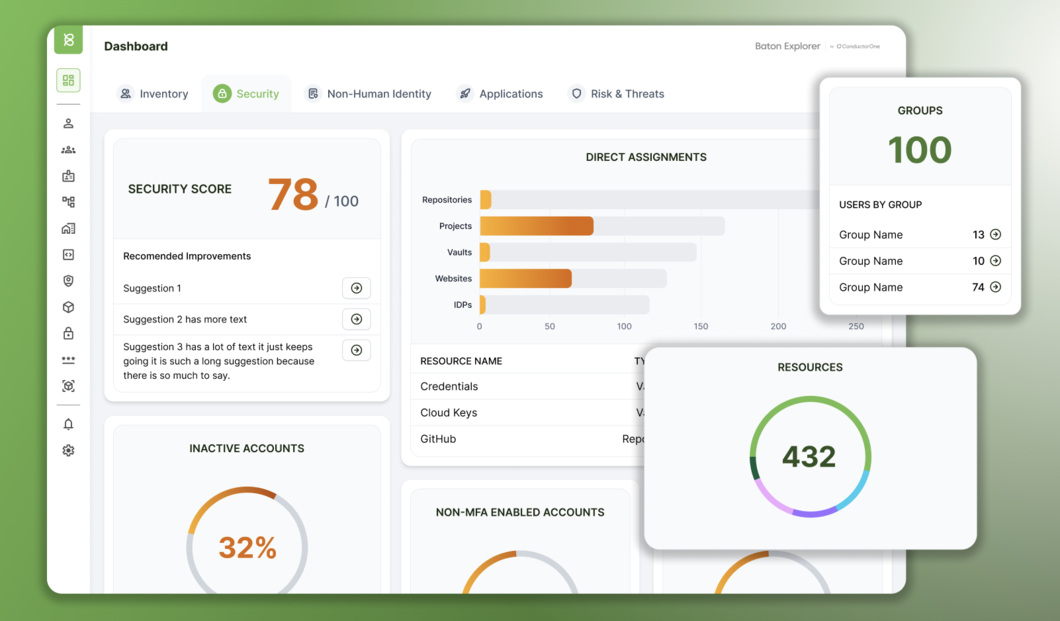
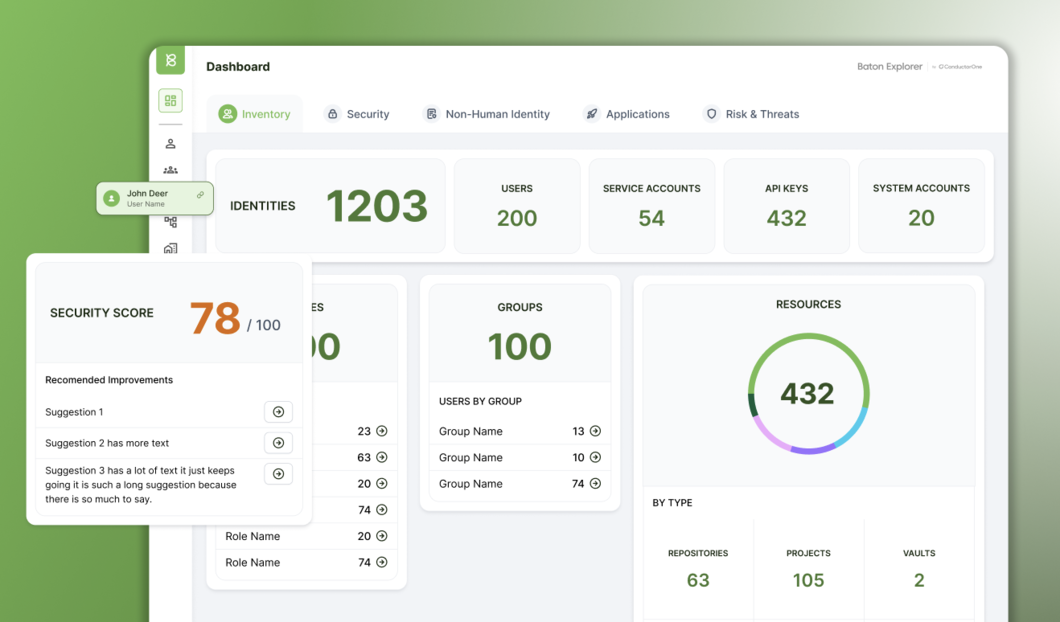
The data visualized in Baton focused on simple graphs and KPIs. Most of the reporting was about volume at that point in time, showing changes over time was not relevant for most dashboards. So we kept the visualizations focused on communicating the KPIs needed for SOC compliance and overall system visibility.
Light and Dark Mode Recommendation
In the 2020s, all dev products need a dark and a light mode. Designing the color palette focused on optimization of limited colors. It was also important to keep the mode switching simple since this was a founding design style.
Light Mode Palette
Dark Mode Palette